No products in the cart.
How fructose drives the liver to make more LDL and VLDL, tanks HDL, spikes triglycerides and why cutting fat alone never worked.
Why Fructose Is Nothing Like Glucose
Most carbohydrates are broken down into simple sugars that the body can absorb and use for energy. While starches such as rice and roti are largely converted into glucose, table sugar (sucrose) provides both glucose and fructose. These sugars are handled very differently by the body.
Glucose is absorbed from the gut and distributed to virtually every cell in the body. Muscles, brain, heart, and organs all take glucose from the bloodstream and use it for fuel. The pancreas responds by releasing insulin, cells open, and glucose enters. The system works as it was designed to.
Fructose is absorbed from the gut but sent almost exclusively to the liver. The liver is the primary organ responsible for metabolizing most dietary fructose, making it central to how excess fructose affects metabolic health.. This makes the liver a dedicated fructose processing plant, one that modern diets push far beyond its design capacity.[1]
| Key distinction: Glucose is metabolized across virtually every tissue in the body. Much of the fructose we consume is taken up by the liver for metabolism, unlike glucose which is readily used by tissues throughout the body. |
Inside the Liver: How Fructose Becomes Fat and Bad Cholesterol
In small amounts, as you would get from eating a whole piece of fruit, the liver handles fructose with ease. The problem is volume, speed, and form. Concentrated fructose from sweetened beverages, packaged snacks, and processed foods arrives without fiber, without the water content of whole fruit, and without the phytonutrients that naturally slow absorption. The liver receives a flood it was not designed to manage.
It is also important to remember that cholesterol levels are influenced by many factors. Genetics, age, menopause, thyroid health, sleep, stress, physical activity, medications, alcohol intake and overall dietary patterns all play a role. Excess added sugars and concentrated fructose are one important piece of this larger metabolic picture—not the entire story.
Source: AI
Step 1: De Novo Lipogenesis — Fat Made From Scratch
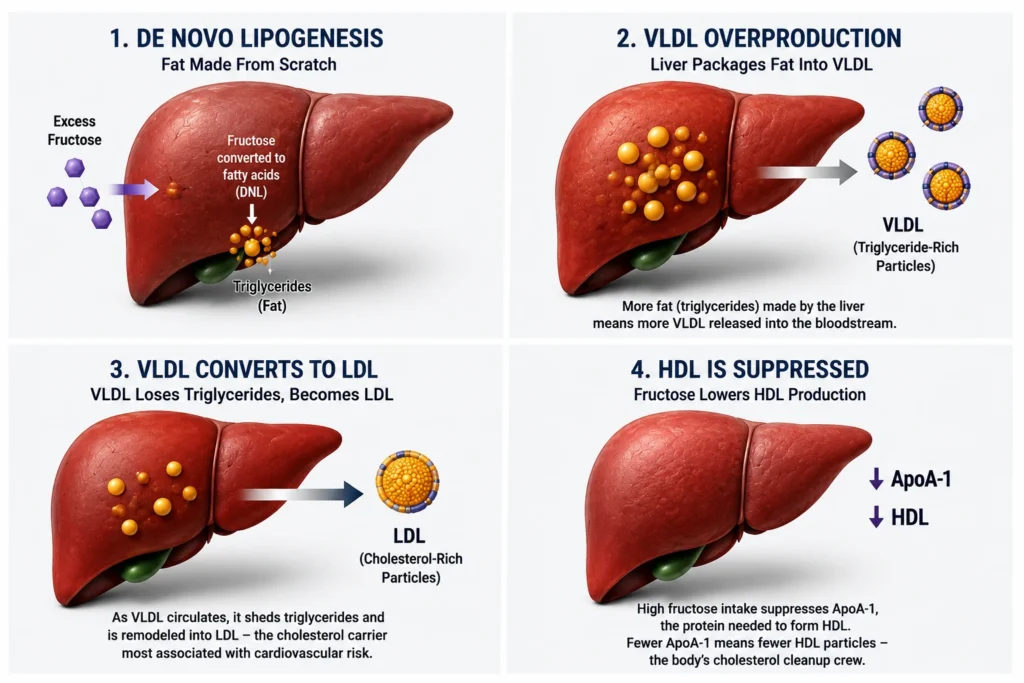
When excess fructose enters the liver, it is converted into fatty acids through a process called de novo lipogenesis (DNL), literally, the creation of fat from a non-fat source. The liver uses fructose as raw material to synthesize triglycerides it would otherwise never need to produce.[2]
Critically, dietary fructose increases the enzymes involved in de novo lipogenesis more powerfully than a high-fat diet does.Excess fructose, particularly from sugar-sweetened beverages and ultra-processed foods, has been shown to stimulate hepatic de novo lipogenesis, contributing to increased triglyceride production. .[2][3]
Step 2: VLDL Overproduction
To export the triglycerides it just manufactured, the liver loads them into Very Low-Density Lipoprotein (VLDL) particles and releases them into the bloodstream. More fructose means more triglyceride synthesis, which means more VLDL secretion. Even 10 to 11 hours of high fructose feeding has been shown in human isotope tracer studies to measurably increase VLDL-triglyceride output, confirming overproduction, not just impaired clearance, as the primary mechanism.[4][5]
Step 3: VLDL Converts to LDL
Circulating VLDL particles shed their triglycerides as they move through the bloodstream. As they shrink, they are remodeled into LDL, the cholesterol carrier most associated with cardiovascular risk. Over time, increased VLDL production may contribute to changes in LDL metabolism and, in susceptible individuals, higher levels of LDL particles. . This is the direct lipid pathway from a sweetened snack to an elevated blood test result.
Step 4: HDL Is Suppressed
High fructose intake suppresses the production of ApoA-1, the structural protein that forms HDL particles. Fewer ApoA-1 molecules mean fewer HDL particles to carry cholesterol from peripheral tissues back to the liver for clearance. High intakes of added fructose have also been associated with lower HDL levels in several studies, further affecting lipid balance..[6]
| The liver responds to excess fructose by making fat, packaging it into VLDL, and releasing it into the bloodstream, where it eventually becomes LDL. This is not theoretical. It has been documented in controlled human feeding trials. |
The Small, Dense LDL Problem Nobody Tells You About
A standard lipid panel tells you your total LDL cholesterol number. It does not tell you what kind of LDL particles you have. That distinction may matter more than the number itself.
LDL exists on a spectrum. Large, buoyant LDL particles are relatively stable. They circulate, perform their biological role, and are cleared by the liver. Small, dense LDL particles are associated with a greater risk of cardiovascular disease than larger LDL particles. . They are far more likely to penetrate arterial walls, oxidize, and initiate plaque formation. Per particle, they carry significantly greater cardiovascular risk than large LDL.
Fructose-driven lipid metabolism specifically promotes the production of small, dense LDL. When the liver churns out excess VLDL loaded with triglycerides, and those particles are processed downstream into LDL, the resulting LDL tends to be small and dense rather than large and buoyant. The same 10-week human trial also found that fructose consumption raised levels of oxidized LDL, apolipoprotein B, and remnant lipoprotein triglycerides, all established markers of elevated cardiovascular risk. Glucose consumption produced none of these changes despite identical caloric intake.[6][7]
| Ask your doctor about this: Advanced lipid panels that measure LDL particle number (LDL-P), small dense LDL, and ApoB give a far more accurate cardiovascular risk picture than total LDL alone. If your diet has been high in sugar or sweetened foods, these are the numbers worth tracking. |
Triglycerides: The Number That Tells You More Than LDL
Fasting triglycerides are one of the most direct windows into how the liver is handling dietary fructose, yet they are frequently underemphasized in standard cholesterol conversations. When the liver converts fructose into fat via de novo lipogenesis, those fats are packaged into VLDL as triglycerides. Short-term high fructose feeding in some controlled trials, as little as a few weeks, can raise fasting triglycerides by 30 to 40 percent without any meaningful change in fat intake. [4][8]
If triglycerides remain elevated, it is worth looking beyond dietary fat alone. Alcohol intake, excess added sugars, overall dietary patterns, insulin resistance, physical activity, and underlying medical conditions can all play a role. . It is about how much concentrated fructose reaches your liver every day. through fruit juices, sweetened beverages, packaged snacks, condiments, and foods that appear healthy on the outside.
Fructose, Uric Acid, and Your Blood Pressure
There is a metabolic byproduct of fructose processing that rarely appears in standard cholesterol discussions but is central to understanding why high fructose diets damage the cardiovascular system well beyond the lipid panel: uric acid.
When the liver processes fructose, it rapidly consumes ATP, the cell’s primary energy currency. The breakdown products of this process generate AMP, which enters the purine degradation pathway and is converted into uric acid. This is the same uric acid associated with gout. But its cardiovascular effects extend far beyond joint pain.[9]
Uric acid directly inhibits nitric oxide production in the endothelium, the inner lining of blood vessels. Nitric oxide is what keeps arteries flexible, relaxed, and resistant to plaque adhesion. Chronically elevated uric acid activates the renin-angiotensin system and suppresses endothelial nitric oxide.This mechanism may contribute to elevated blood pressure independently of sodium intake in some individuals..[9][10]
Elevated uric acid also feeds back into the liver to further stimulate de novo lipogenesis, creating a self-reinforcing cycle: fructose generates uric acid, uric acid drives more fat production, and more fat production worsens the lipid panel and arterial health.[9]
This explains a pattern seen frequently in clinical practice: someone with well-controlled cholesterol who still develops hypertension and arterial stiffness. While statins play an important role in lowering LDL cholesterol and reducing cardiovascular risk, they do not directly address excess fructose intake or uric acid production, which may also influence metabolic health.
What You Can Actually Do About It, Starting Today
Information without a practical path is just anxiety on paper. Here is what works, in order of impact.
Remove concentrated fructose in liquid form first
Sweetened beverages (fruit juices, packaged health drinks, energy drinks, flavored water, sports drinks) deliver fructose with zero fiber and at maximum absorption speed. They are the single highest-impact item to address. A 250 ml glass of commercial apple juice can carry 22 to 28 grams of fructose, the equivalent of eating three to four whole apples, with none of the fiber that would slow its arrival at the liver. Replacing your morning juice with one whole fruit and water is a more meaningful metabolic intervention than most people realize.
Whole fruit is not the enemy. Form and fiber are everything
Two servings of whole, intact fruit per day is appropriate for most healthy people. The liver was designed to handle fructose from fruit in small quantities, arriving slowly because fiber slows transit and extends the absorption window. The problem is concentrated fructose without fiber in beverages, syrups, and processed food.
The difference between eating a mango and drinking mango juice is not a minor one. It is a fundamentally different metabolic event at the liver level. The same applies to dates versus date syrup and apples versus apple juice concentrate.
Sequence matters. Eat fructose with protein, fat, and fiber
Context changes metabolism. Fructose consumed after a balanced meal that includes protein, fat, and fiber arrives at the liver far more slowly than the same fructose consumed on an empty stomach or in isolation. Have fruit after a meal rather than instead of one. Eat a date with a handful of nuts, not alone. This is not about restriction; it is about smart sequencing that gives the liver processing time rather than a sudden load.
Every small choice matters. Learn how the FLOW philosophy can help you create sustainable habits that support your body, mind, and long-term health.
Rebuild the liver’s metabolic capacity
The liver is one of the most regenerative organs in the body. Giving it the right conditions allows significant recovery of function. The most evidence-supported approaches include:
- Consistent and natural circadian fasting windows of 12 to 14 hours give the liver time to clear accumulated triglycerides and reset insulin sensitivity
- Choline-rich foods such as eggs, liver, and sunflower lecithin and other choline-rich foods support the liver’s ability to export fat as VLDL rather than store it
- Quality sleep. Poor sleep independently increases fructose cravings and impairs hepatic fat clearance through cortisol dysregulation
- 30 minutes of daily movement, even brisk walking, activates fat oxidation pathways that reduce the liver’s triglyceride burden
- Magnesium from pumpkin seeds, dark leafy greens, and almonds supports over 300 enzymatic reactions including those in hepatic fat metabolism
Manage uric acid to protect vascular health
Since fructose raises uric acid, which suppresses nitric oxide, which stiffens arteries, addressing uric acid is part of addressing the full cardiovascular picture, not just the lipid panel.
- Stay consistently well hydrated. Uric acid accumulates and crystallizes when urine is concentrated
- Limit or eliminate alcohol, which competes with uric acid for kidney excretion
- Vitamin C-rich foods, adequate hydration, balanced nutrition, and reducing excess added sugars may help support healthy uric acid levels.
- Reducing concentrated fructose is the most direct intervention. Less fructose means less AMP breakdown, which means less uric acid produced at the source.
Track the markers that actually reflect fructose metabolism
Standard lipid panels are a starting point, not the full picture. When asking your doctor for bloodwork, consider requesting:
- Fasting triglycerides: The most direct reflection of liver fructose overload
- Triglyceride-to-HDL ratio: Calculated from a standard lipid panel, one of the best proxies for insulin resistance
- Fasting insulin: Often the first measurable sign of hepatic insulin resistance caused by chronic fructose excess
- HbA1c alongside fasting glucose: Provides a three-month average of sugar metabolism
- Serum uric acid: If elevated above 5.5 mg/dL in women or 6.5 mg/dL in men, fructose overload is a strong consideration
- ApoB or LDL particle number where available: Tells you whether your LDL particles are the dangerous small, dense type
Reading Labels: Where Fructose Hides in Packaged Food
Food manufacturers are sophisticated. When consumer awareness of HFCS grew, the industry renamed it or replaced it with other fructose-containing ingredients that sound natural, scientific, or benign. Understanding this language is not optional for anyone managing their metabolic health through food choices.
Names used for fructose or fructose-containing ingredients on Indian food labels
| Ingredient Name on Label | What It Actually Is | Fructose Risk |
| High Fructose Corn Syrup (HFCS) | Industrially processed, 42-55% fructose | Very High |
| Crystalline Fructose / Fructose | Pure isolated fructose, up to 99% by weight | Extremely High |
| Corn Syrup / Corn Syrup Solids | Processed glucose-fructose mixture | High |
| Agave Nectar / Agave Syrup | 70-90% fructose, higher than HFCS despite “natural” label | Extremely High |
| Invert Sugar / Invert Syrup | Sucrose split into 50% glucose + 50% fructose | High |
| Fruit Juice Concentrate | Concentrated fruit sugar with fiber removed | High |
| Honey | Approximately 40% fructose | Moderate-High |
| Maple Syrup | Predominantly sucrose with significant fructose | Moderate |
| Coconut Sugar | 35-40% fructose despite its lower glycemic index | Moderate |
| Date Paste / Date Syrup | Fiber removed in processed forms; concentrated fructose | Moderate-High |
| Stevia / Erythritol / Monk Fruit | Not fructose-based; do not drive hepatic de novo lipogenesis | Very Low |
Five rules for reading Indian food labels for hidden fructose
- Look at Total Sugars on the Nutrition Information Panel. FSSAI mandates this per 100 g. Any figure above 5 g per 100 g in a packaged product warrants a full ingredient list read.
- Ingredients are listed in descending order by weight. If any fructose-containing ingredient appears in the first three positions, the product is high-fructose by design.
- Count all fructose sources together. A product might list honey, fruit juice concentrate, and invert sugar separately, each appearing small in quantity, but together they can constitute 25 to 35 percent of the product by weight.
- Check actual serving size against what you eat. Products often declare a 20g serving when the item weighs 40g. The sugar figure you read doubles in practice.
- “No Added Sugar” does not mean no fructose. Under current FSSAI definitions, honey, agave, date paste, and fruit juice concentrate are excluded from the “added sugar” classification. Front-of-pack claims can sometimes create a healthier impression than the ingredient list reveals. Always read both before making a decision.
Categories most commonly sold as healthy but high in fructose
Source: AI
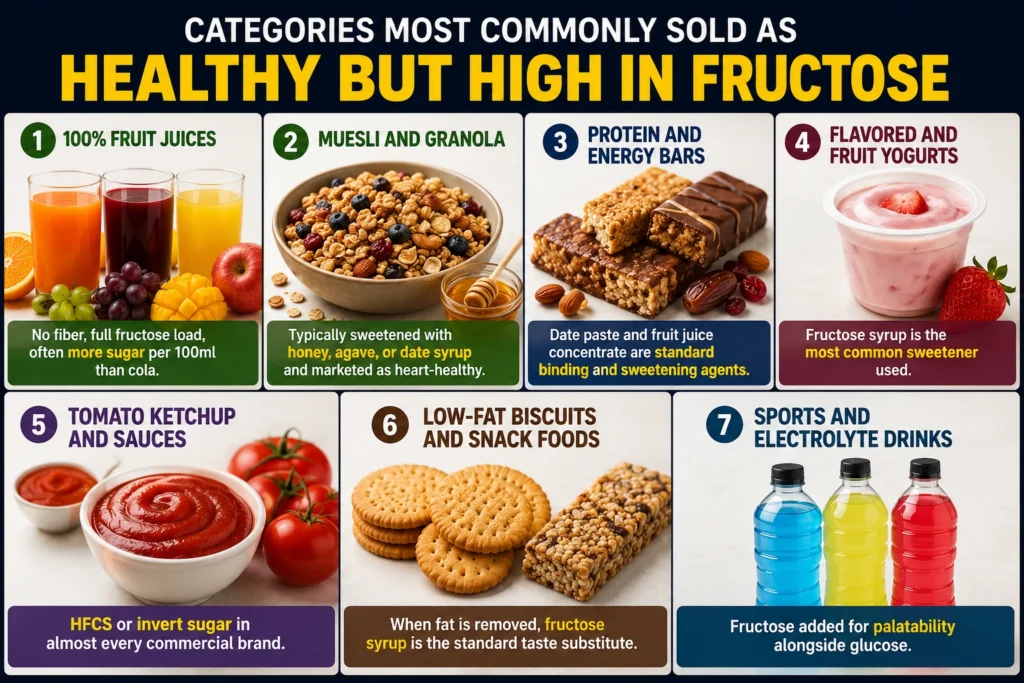
- 100% Fruit Juices: No fiber, full fructose load, often more sugar per 100 ml than cola
- Muesli and Granola: Typically sweetened with honey, agave, or date syrup and marketed as heart-healthy
- Protein and Energy Bars: Date paste and fruit juice concentrate are standard binding and sweetening agents
- Flavored and Fruit Yogurts: Fructose syrup is the most common sweetener used
- Tomato Ketchup and Sauces: HFCS or invert sugar in almost every commercial brand
- Low-Fat Biscuits and Snack Foods: When fat is removed, fructose syrup is the standard taste substitute
- Sports and Electrolyte Drinks: Fructose added for palatability alongside glucose
The Bottom Line
Cholesterol is not simply a fat problem; it is a liver problem driven by fructose overload.In many people, particularly those with insulin resistance, metabolic syndrome, or fatty liver, excess added sugars and fructose may contribute alongside other lifestyle and genetic factors. The liver responds to excess fructose by manufacturing fat via de novo lipogenesis, packaging it into VLDL, releasing it into the bloodstream, and producing LDL as a downstream consequence, while simultaneously suppressing HDL production. Triglycerides rise. Small, dense LDL particles accumulate. Uric acid climbs and disables nitric oxide in vessel walls. Blood pressure rises. Arteries stiffen.
All of this while the person eats a faithfully low-fat diet, because nobody connected the dots between the fruit juice at breakfast, the low-fat granola bar mid-morning, the “healthy” ketchup at lunch, and the lipid panel that keeps coming back wrong.
The intervention is not complicated. Remove concentrated fructose in liquid and processed forms. Eat whole fruit with its fiber intact. Rebuild liver health deliberately. Read labels without being deceived by front-of-pack claims. Track the numbers that actually reflect fructose metabolism: fasting triglycerides, the TG-to-HDL ratio, fasting insulin, and serum uric acid.
Struggling with High Cholesterol, Fatty Liver, or Prediabetes?
Our approach works alongside your medical care, helping address nutrition, sleep, stress, movement and other lifestyle factors that influence metabolic health.
Our team of foundational medicine experts works with you to identify root causes and create a personalized roadmap for better metabolic health.
Explore our Wellness Program
Call us at 1800 102 0253 or write to us at [email protected].
Disclaimer: This article is intended for educational purposes only and should not be considered medical advice. Individual health conditions, medications, and nutritional needs vary. Always consult your healthcare practitioner before making significant changes to your diet, lifestyle, or treatment plan. The information shared here is designed to support awareness and informed decision-making, not replace professional medical guidance.
References
- Sacks FM et al. The Effect of Diet on Cardiovascular Disease and Lipid and Lipoprotein Levels. Endotext, NCBI Bookshelf. Updated March 2024. NBK570127. Available at: ncbi.nlm.nih.gov/books/NBK570127
- Sanders FWB, Griffin JL. De novo lipogenesis in the liver in health and disease: more than just a shunting yard for glucose. Biological Reviews. 2016;91(2):452-468. PMC4832395.
- Alwahsh SM, Gebhardt R. Dietary fructose as a risk factor for non-alcoholic fatty liver disease (NAFLD). Archives of Toxicology. 2017;91(4):1545-1563.
- Chiu S, Sievenpiper JL, de Souza RJ et al. Effect of fructose on established lipid targets: a systematic review and meta-analysis of controlled feeding trials. Journal of the American Heart Association. 2014;3(6):e001700. doi:10.1161/JAHA.114.001700
- Hirahatake KM, Schwartz JM, Stanhope KL et al. The Effect of Fructose Feeding on Intestinal and Hepatic VLDL-TG Kinetics and De Novo Fatty Acid Synthesis in Humans. PMC7353183. 2020.
- Stanhope KL, Schwarz JM, Keim NL et al. Consuming fructose-sweetened, not glucose-sweetened, beverages increases visceral adiposity and lipids and decreases insulin sensitivity in overweight/obese humans. Journal of Clinical Investigation. 2009;119(5):1322-1334. doi:10.1172/JCI37385
- Livesey G, Taylor R. Fructose consumption and serum LDL-cholesterol concentration: a systematic review and meta-analysis of controlled feeding trials. Journal of Nutrition. 2013;143(9). doi:10.3945/jn.113.182139
- Stanhope KL, Medici V, Bremer AA et al. A dose-response study of consuming high-fructose corn syrup-sweetened beverages on lipid/lipoprotein risk factors for cardiovascular disease in young adults. American Journal of Clinical Nutrition. 2015;101(6):1144-1154.
- Johnson RJ, Gomez-Pinilla F, Nagel M et al. Fructose and Uric Acid: Major Mediators of Cardiovascular Disease Risk Starting at Pediatric Age. PMC7352635. Nutrients. 2020.
- Baena M, Sangüesa G, Hutter N et al. Fructose at the crossroads of the metabolic syndrome and obesity epidemics. Frontiers in Bioscience. 2019;24(2):186-211. doi:10.2741/4713.